|
Using Google Forms, we created a survey and asked people basic information about themselves and if they own any pets.
|
Information about our Respondents
To start off, 59% of our respondents are Hispanic/Latino, 15% are Asian, 13% are White/Caucasian, and 9% are Black/African American. Around 55% of our respondents are female and 43% are male, with 3% as "other". Our respondents main age group are 0-17 years old (64%), 15% being 18-25, 7% being 26-40, 11% being 41-54, and 4% being 55+. About 65% of our respondents live in an urban society, with 32% living in a suburban society and 3% in a rural society. Despite age, 49% of our respondents are single, 32% are in a relationship, 11% are married with children and 6% are married without children.
Our Respondents Pets & Their Bowls
About 76% of our respondents grew up with pets and 24% did not grow up with pets. About 74% currently have pets, while 26% do not have pets. Since 74% of our respondents currently have pets, about 54% of them have 1-2 pets, while 46% have 3+ pets. Around 56% of our respondents have pets that weigh 0-15 pounds, 27% weigh 16-28 pounds, and 17% weigh 29+ pounds.
|
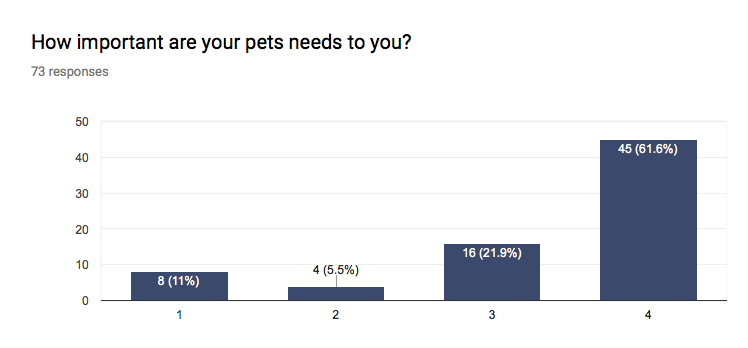
We all care for our pets in many ways. This chart shows results from our survey asking the question "How important are your pets needs to you?". We set up a scale from 1 to4, 4 being most important. About 62% of our respondents rate their pets needs at a 4, 22% at 3, 6% at 2, and 11% at 1. This shows our main audience of pet owners really care for their pets and their needs.
Around 69% of our respondents feed their pets twice a day, 22% feed their pets once a day, 3% feed their dogs 2-3 a day, and 6% don't feed their pets because they most likely don't have pets. These responses lead into the questions about their pet bowls. About 83% of our respondents have 1-2 bowls they use, while the other 17% use 3+ bowls. About 38% of our respondents clean their bowls once a week, 29% clean their bowls twice a week, 14% clean their bowls once a month, 15% never clean their bowls. Around 44% of our respondents have bowls that lasted a year, 42% lasted a few months, some others don't have pet bowls or lasted longer than a year. About 62% keep their bowls inside, 29% keep their bowls outside, and 8% keep their bowls both inside and outside.
|
|
Our Respondents Budget
Our survey results show that 20% of our respondents buy their supplies at pet stores, 30% buy their supplies at stores such as Target and Walmart, 5% buy online, 40% buy from both stores and online, and 8% don't have pets. About 45% of our respondents spend $0-50 on pet supplies monthly, 36% spend $51-100 monthly, 7% spend $101-200 monthly, 9% spend $300-500 monthly, and 4% spend $500+ monthly.
Click here to take our survey!
